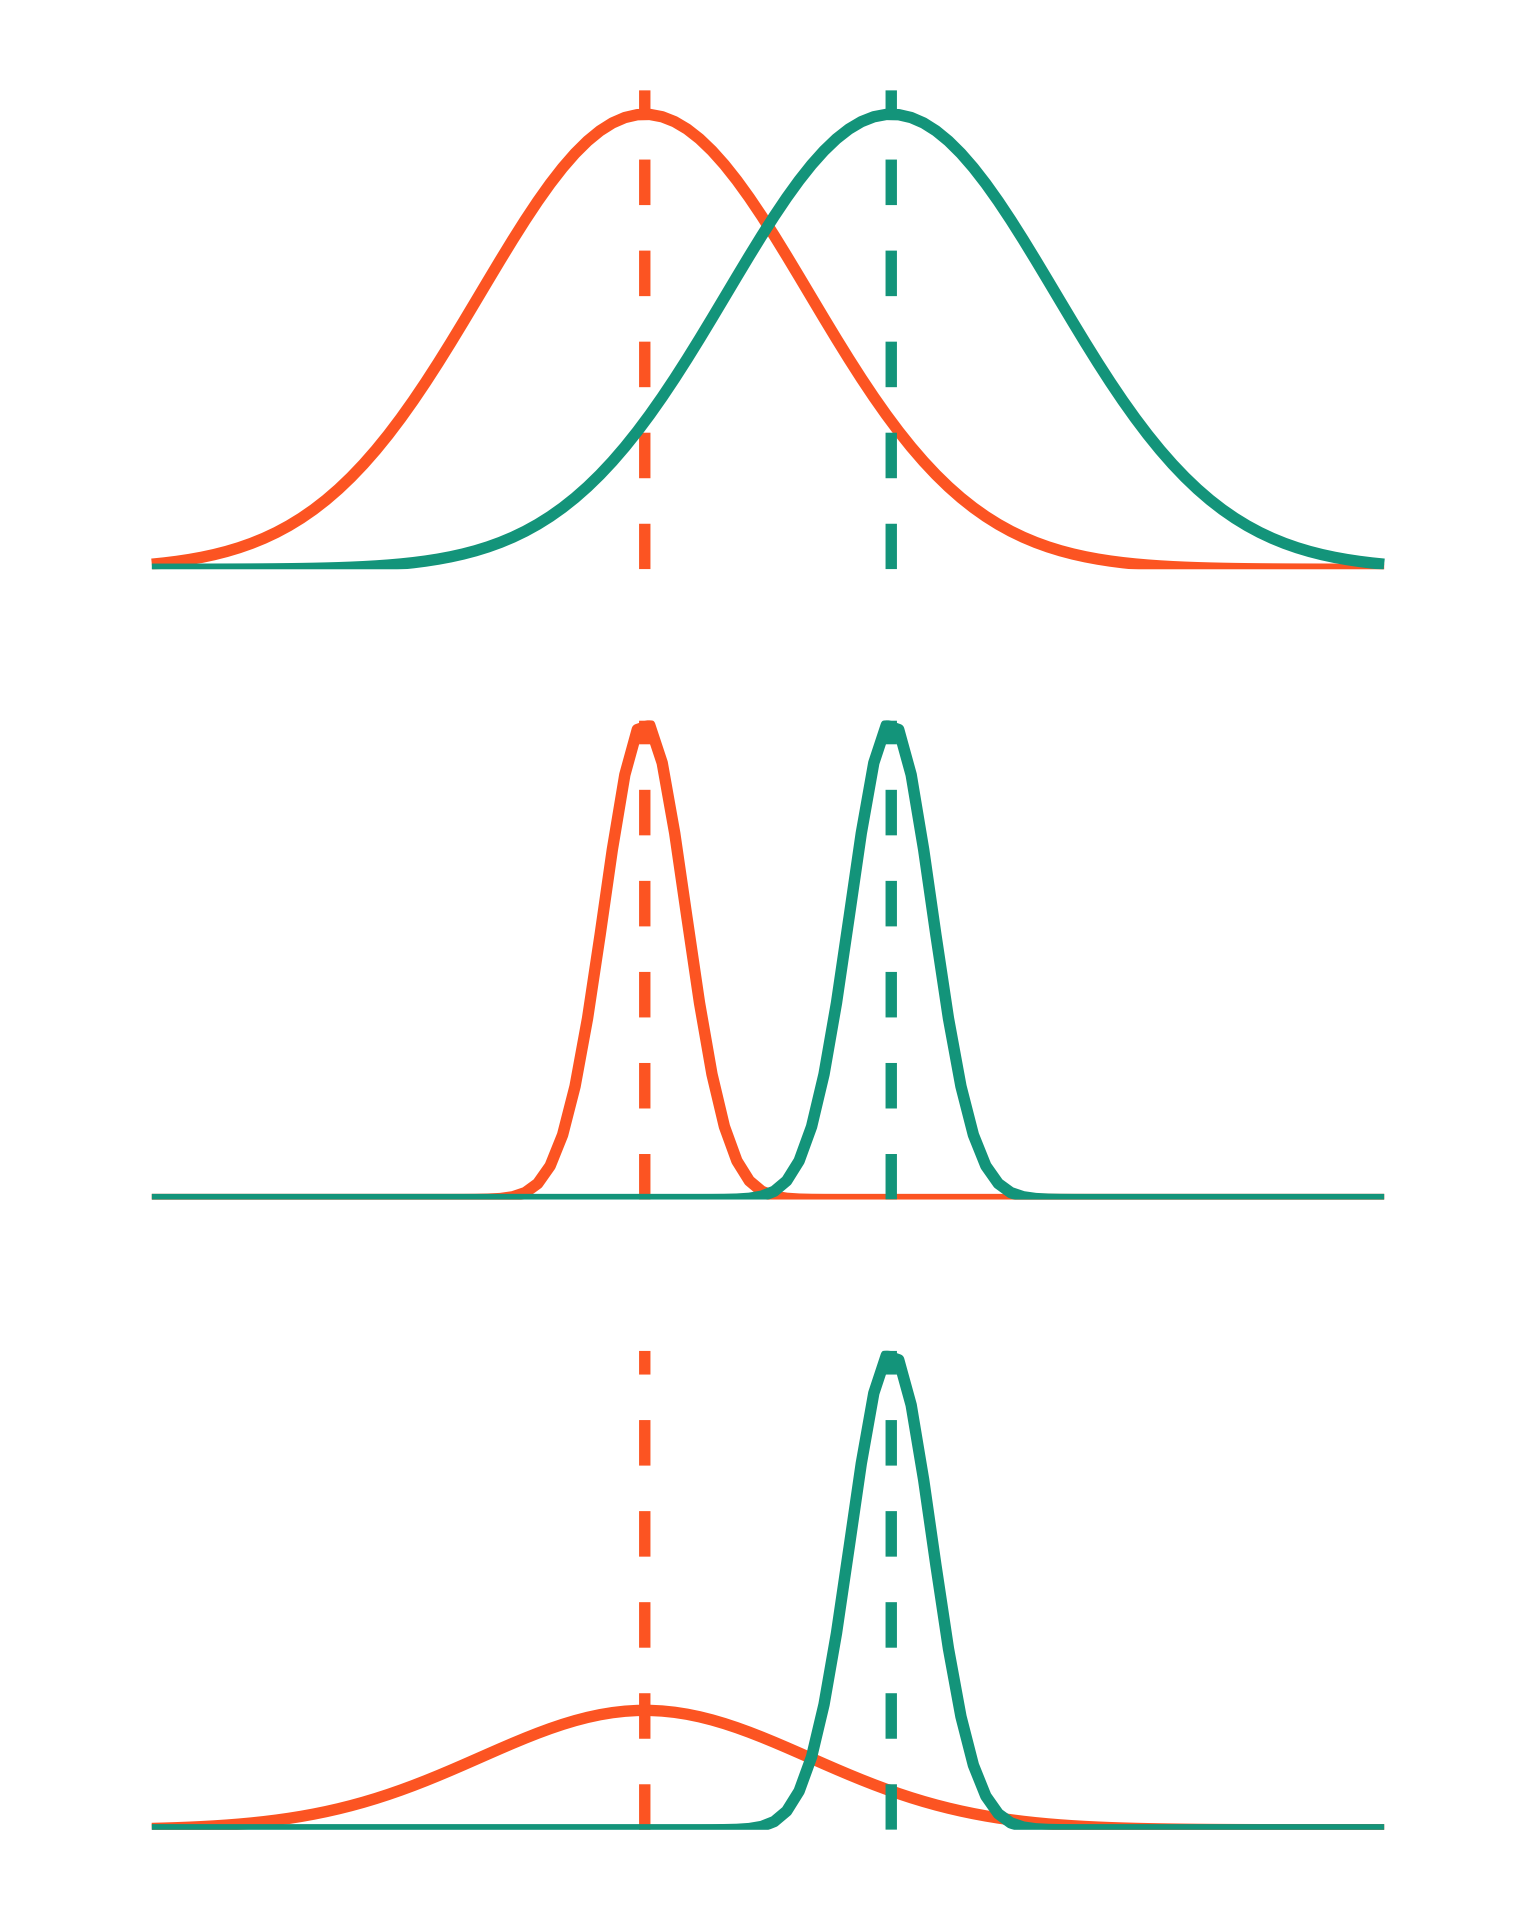
Lecture 05 figures

t-test
welch
student
paired
F-test
Author
Affiliation
Published

May 1, 2023

test statistic for unequal variances (welch’s)

\[ t_s = \frac{\bar{x}_A - \bar{x}_B}{\sqrt{\frac{s^2_A}{n_A} + \frac{s^2_B}{n_B}}} \]

degrees of freedom for unequal variances (welch’s)

\[ df = \frac{(\frac{s^2_A}{n_A} + \frac{s^2_B}{n_B})^2}{\frac{(s^2_A/n_A)^2}{n_A - 1} + \frac{(s^2_B/n_B)^2}{n_B - 1}} \]

test statistic for equal variances (student’s t)

\[ t_s = \frac{\bar{x}_A - \bar{x}_B}{s_p\sqrt{\frac{1}{n_A} + \frac{1}{n_B}}} \]

test statistic for paired t-test

\[ t_s = \frac{\bar{x}_d - \mu_0}{s_d - \sqrt{n}} \]

test statistic for F test \[ F = \frac{s^2_A}{s^2_B} \]

differences in variances

Code
library(tidyverse)
library(patchwork)

small <- ggplot(data.frame(x = -6:9), aes(x)) +
  stat_function(geom = "line", n = 100, fun = dnorm, args = list(mean = 0, sd = 2), linewidth = 2, color = "#FF6B2B") +
  geom_vline(aes(xintercept = 0), color = "#FF6B2B", lty = 2, linewidth = 2) +
  stat_function(geom = "line", n = 100, fun = dnorm, args = list(mean = 3, sd = 2), linewidth = 2, color = "#00A38D") +
  geom_vline(aes(xintercept = 3), color = "#00A38D", lty = 2, linewidth = 2) +
  scale_y_continuous(expand = c(0, 0), limits = c(0, 0.21)) +
  theme_void() +
  theme(plot.margin = unit(c(1, 1, 1, 1), "cm"))

big <- ggplot(data.frame(x = -6:9), aes(x)) +
  stat_function(geom = "line", n = 100, fun = dnorm, args = list(mean = 0, sd = 0.5), linewidth = 2, color = "#FF6B2B") +
  geom_vline(aes(xintercept = 0), color = "#FF6B2B", lty = 2, linewidth = 2) +
  stat_function(geom = "line", n = 100, fun = dnorm, args = list(mean = 3, sd = 0.5), linewidth = 2, color = "#00A38D") +
  geom_vline(aes(xintercept = 3), color = "#00A38D", lty = 2, linewidth = 2) +
  scale_y_continuous(expand = c(0, 0), limits = c(0, 0.8)) +
  theme_void() +
  theme(plot.margin = unit(c(1, 1, 1, 1), "cm"))

unequal <- ggplot(data.frame(x = -6:9), aes(x)) +
  stat_function(geom = "line", n = 100, fun = dnorm, args = list(mean = 0, sd = 2), linewidth = 2, color = "#FF6B2B") +
  geom_vline(aes(xintercept = 0), color = "#FF6B2B", lty = 2, linewidth = 2) +
  stat_function(geom = "line", n = 100, fun = dnorm, args = list(mean = 3, sd = 0.5), linewidth = 2, color = "#00A38D") +
  geom_vline(aes(xintercept = 3), color = "#00A38D", lty = 2, linewidth = 2) +
  scale_y_continuous(expand = c(0, 0), limits = c(0, 0.8)) +
  theme_void() +
  theme(plot.margin = unit(c(1, 1, 1, 1), "cm"))

small/big/unequal

demonstration of power analysis:

Code
library(pwr)

pwr.t.test(n = NULL, d = 0.5, sig.level = 0.05, power = 0.95)

     Two-sample t test power calculation 

              n = 104.9279
              d = 0.5
      sig.level = 0.05
          power = 0.95
    alternative = two.sided

NOTE: n is number in *each* group
Code
pwr.t.test(n = NULL, d = 0.7, sig.level = 0.05, power = 0.80)

     Two-sample t test power calculation 

              n = 33.02457
              d = 0.7
      sig.level = 0.05
          power = 0.8
    alternative = two.sided

NOTE: n is number in *each* group

U statistic: \[ \begin{align} U_1 &= \Sigma R_1 - n_1(n_1 + 1)/2 = 17 - 5(5+1)/2 = 2 \\ U_2 &= \Sigma R_2 - n_2(n_2 + 1)/2 = 38 - 5(5+1)/2 = 23 \end{align} \]

Code
Sample1 <- c(1.1, 2.4, 1.8, 0.4, 1.6)
Sample2 <- c(5.4, 3.1, 2.3, 1.9, 4.2)
wilcox.test(Sample1, Sample2)

    Wilcoxon rank sum exact test

data:  Sample1 and Sample2
W = 2, p-value = 0.03175
alternative hypothesis: true location shift is not equal to 0
Code
# for a comparison of one group against a theoretical median
wilcox.test(SampleA, mu = theoretical)

# for a comparison of two groups
wilcox.test(SampleA, SampleB, paired = TRUE)

balanced design using Student’s t:

\[ \begin{align} SE_{\bar{x}_A-\bar{x}_B} &= s_p\sqrt{\frac{1}{n_A} + \frac{1}{n_B}} \\ Scenario 1 &: s_p\sqrt{\frac{1}{5} + \frac{1}{25}} = s_p*0.49 \\ Scenario 2 &: s_p\sqrt{\frac{1}{15} + \frac{1}{15}} = s_p*0.37 \end{align} \]

Citation

BibTeX citation:
@online{bui2023,
  author = {Bui, An},
  title = {Lecture 05 Figures},
  date = {2023-05-01},
  url = {https://an-bui.github.io/ES-193DS-W23/lecture/lecture-05_2023-05-01.html},
  langid = {en}
}
For attribution, please cite this work as:
Bui, An. 2023. “Lecture 05 Figures.” May 1, 2023. https://an-bui.github.io/ES-193DS-W23/lecture/lecture-05_2023-05-01.html.