library(tidyverse) # general usagelibrary(here) # organizationlibrary(naniar) # missing data visualizationlibrary(skimr) # quick glimpse at datalibrary(plotly) # interactive plotslibrary(magick) # insert images into plotslibrary(NatParksPalettes) # one example of color palette packagelibrary(wesanderson) # another example of color palette packagelibrary(patchwork) # put plots together
load in the data
Code
# create a new object called whales# read in the whales datawhales <-read_csv(here("workshop", "data", "Graywhale_watching_2007_2019.csv"))
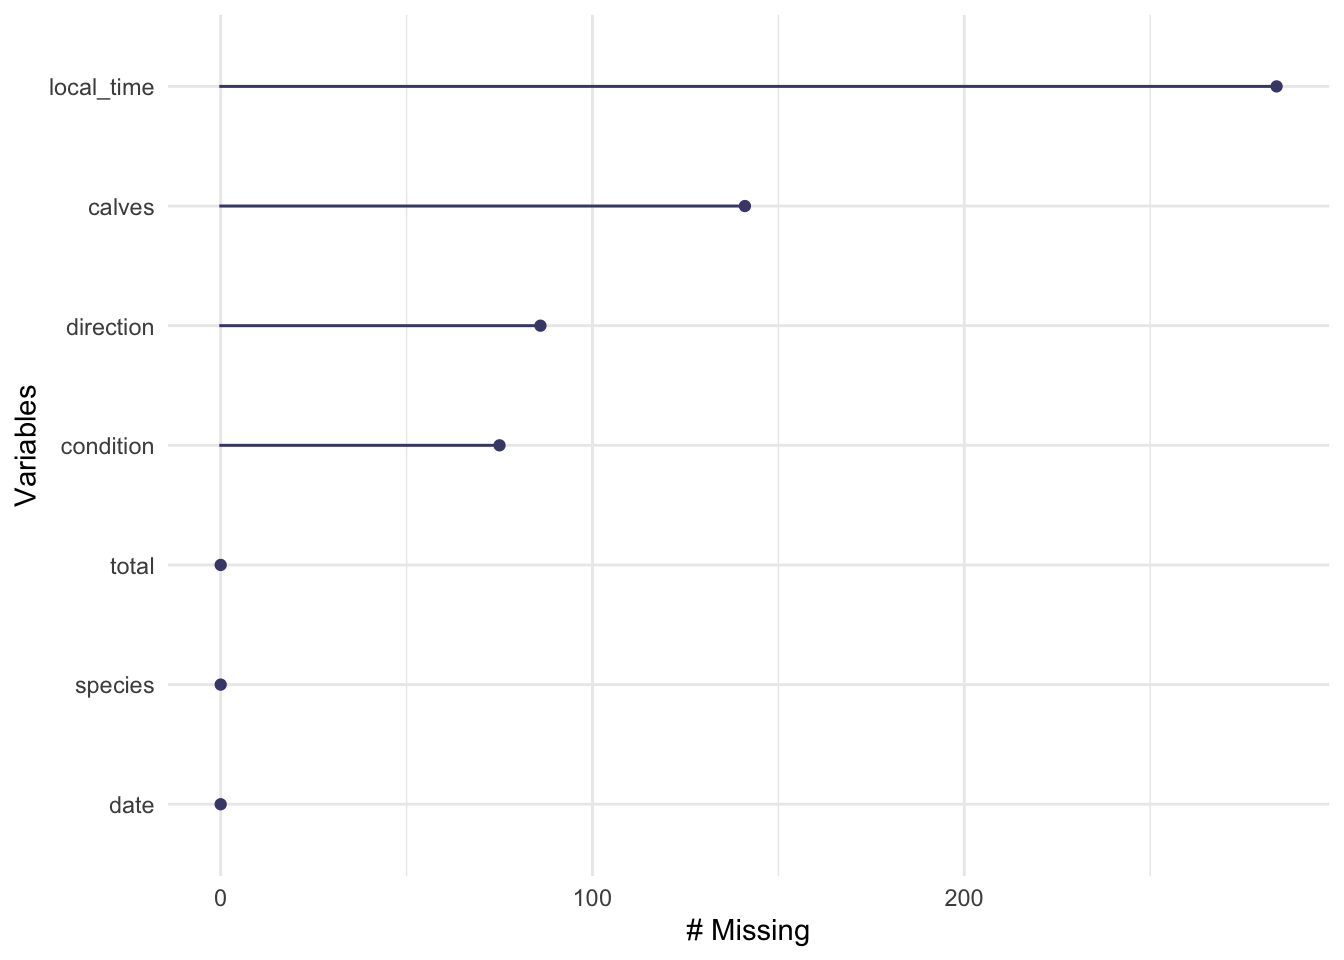
look at missing data:
Code
gg_miss_var(whales)
use skimr package to quickly glimpse the data:
Code
skim(whales)
Data summary
Name
whales
Number of rows
5005
Number of columns
7
_______________________
Column type frequency:
character
3
Date
1
difftime
1
numeric
2
________________________
Group variables
None
Variable type: character
skim_variable
n_missing
complete_rate
min
max
empty
n_unique
whitespace
condition
75
0.99
4
13
0
37
0
direction
86
0.98
3
14
0
2589
0
species
0
1.00
21
21
0
1
0
Variable type: Date
skim_variable
n_missing
complete_rate
min
max
median
n_unique
date
0
1
2007-02-01
2019-05-19
2014-04-07
1021
Variable type: difftime
skim_variable
n_missing
complete_rate
min
max
median
n_unique
local_time
284
0.94
2520 secs
63420 secs
12:26:00
547
Variable type: numeric
skim_variable
n_missing
complete_rate
mean
sd
p0
p25
p50
p75
p100
hist
total
0
1.00
2.25
2.46
0
1
2
2
65
▇▁▁▁▁
calves
141
0.97
0.33
0.66
0
0
0
1
6
▇▁▁▁▁
wrangling
Code
whales_clean <- whales %>%# creating new columns for years and monthsmutate(year_new = lubridate::year(date)) %>%mutate(month_new = lubridate::month(date)) %>%# create a new column for month namesmutate(month_name =case_when( month_new ==2~"February", month_new ==3~"March", month_new ==4~"April", month_new ==5~"May" ),month_name = forcats::as_factor(month_name),month_name = forcats::fct_relevel(month_name, "February", "March", "April", "May") ) %>%mutate(condition_new =case_when( stringr::str_detect(condition, "Excellent") ~"excellent", stringr::str_detect(condition, "Good") ~"good", stringr::str_detect(condition, "Fair") ~"fair", stringr::str_detect(condition, "Poor") ~"poor" ))
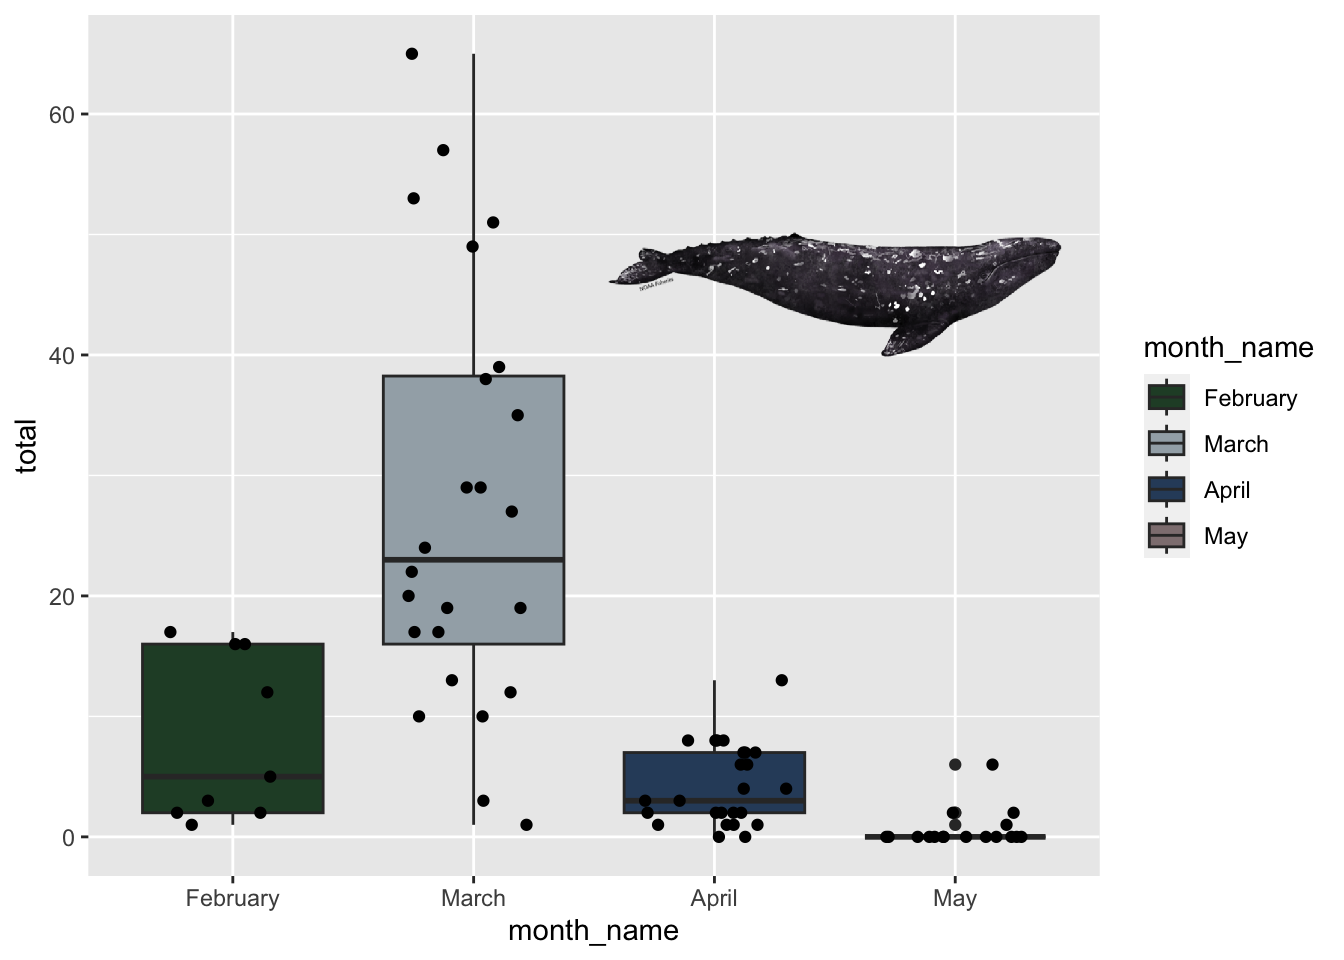
create a plot and insert an image
Code
# create a new data frame to filter 2019 observationswhales_2019 <- whales_clean %>%filter(year_new ==2019)# read in the whale png as a rasterwhale_image <- magick::image_read(here("workshop", "images", "noaa-gray-whale.png")) %>%as.raster()# make a boxplotwhales_2019_boxplot <-ggplot(data = whales_2019, aes(x = month_name, y = total)) +geom_boxplot(aes(fill = month_name)) +geom_point(position =position_jitter(width =0.3, height =0, seed =1000)) +scale_fill_manual(values =natparks.pals("RockyMtn", 4)) +annotation_raster(whale_image, xmin =2.5, xmax =4.5, ymin =30, ymax =60)whales_2019_boxplot